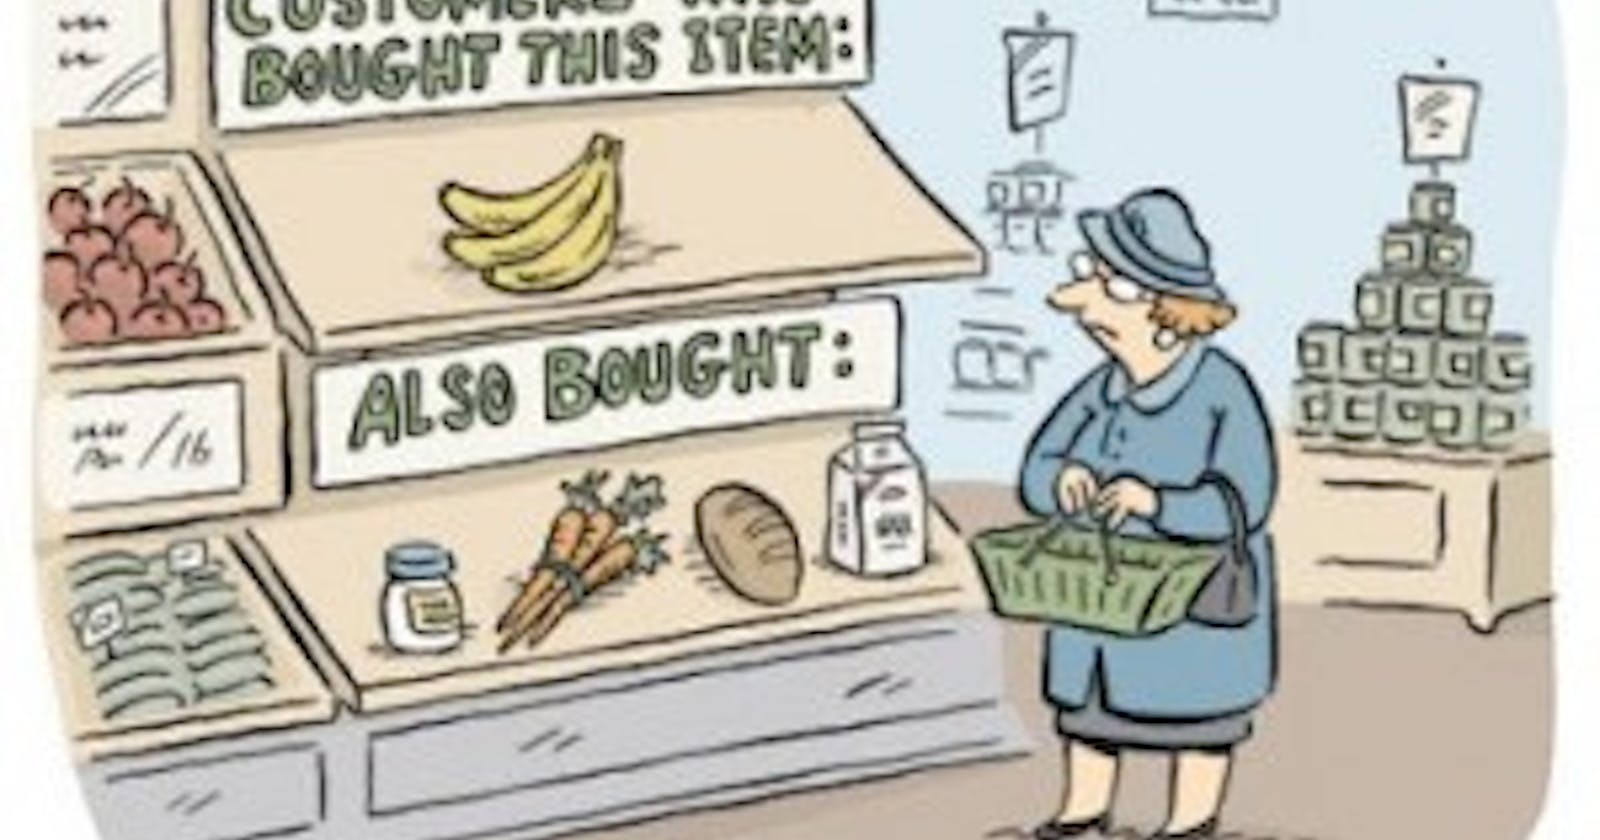
Hold onto your shopping carts, folks, because we're about to embark on a thrilling data analysis expedition through the aisles of an e-commerce store! Today's weapon of choice? Python. Our mission? To uncover the hidden patterns lurking within customer data, using the power of market basket analysis.
First things first, we need some groceries... I mean, data! We'll be rummaging through a dataset of customer transactions, each record showing the item description and purchase date. This data is publicly available on GitHub. Feel free to do some analysis and share your insights.
I imported all packages relevant for the analysis and also imported the data to Python. I used Jupiter Notebook for the analysis. The column names were not very descriptive so I changed them from (Member_number, Date, itemDescription) to (cust_id, Date, item). Next... Duplicate purchases? There were 759 duplicates and that is less than 5% of the dataset so... Begone!
Next, I decided to see which items are most popular among buyers. We'll do this by calculating the "support" of each item, (Support is a metric that works just like taking a headcount of how often they appear in purchases). To do this, I grouped the data by customer to show purchases made by the same person on the same day as a list in the item column. Then I calculated the mean of the one hot encoded data (i.e. the support).
With the highest support value, whole milk, the MVP, takes the crown! But wait, which products are "gathering dust" on the e-shelf? Let's find out.
After sorting the dataframe by support value in ascending order. Turns out, preservation products and baby cosmetics are the least frequently purchased in this store.
Next! I used the Apriori algorithm, a fancy "friend-finding" tool, to discover items that frequently bought together. This algorithm is important because there is a very large number of possible combinations of items sold together, so the algorithm uses certain metrics to reduce the number of itemsets by removing subsets of infrequent sets. I used the support metric to do this and I used the minimum support threshold as 0.005 which is the median of the support of the items.
Boom! We've got ourselves the following item "besties", ready to be paired up for cross-selling promotions.
(other vegetables) --> (frankfurter)
(frankfurter) --> (other vegetables)
(sausage) --> (soda)
(soda) --> (sausage)
(sausage) --> (yogurt)
(yogurt) --> (sausage)
But wait, there's more! We need to know who's got the real "confidence," like that friend who convinces you to try that weird new food combination. I calculated the confidence of each item pair, which is the likelihood of buying one item after seeing the other.
Turns out, Whole milk, other vegetables, rolls/buns, soda and yogurt are quite persuasive. Thus, if they are bought, there's a possibility of buying the next viewed item.
Areas for Further Exploration
Advanced Algorithms: There's a whole world of association rule mining algorithms out there, waiting to be unleashed! We just explored one - the Apriori algorithm. We can explore other algorithms to uncover more complex relationships between items.
Predictive Modelling: We can develop models to predict customer behavior based on the patterns in this data. Feel free to do these and let me know how it goes!
So, there you have it! We've tried our hands at some market basket analysis using Python and gained some insights. Do you think these insights make sense? Do you buy milk more often? Have you ever thought of buying frankfurter after buying some vegetables? Let me know in the comments.
Note: This project is part of the deliverables for the Flit Apprenticeship Data Analytics/Data Science Program.
You can find the project Notebook and dataset here on GitHub. Have fun analyzing!
